If a picture is worth a thousand words, this 16-second animation that a European scientist developed is a lengthy and well-sourced climate history book.
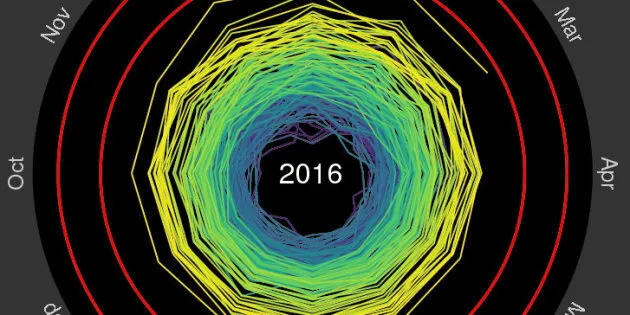
Ed Hawkins, a climate scientist at the University of Reading in the United Kingdom, posted to Twitter on Monday a GIF depicting global temperatures steadily spiraling upward over the past 166 years.
The colorful infographic is simple, gripping and alarming. As the planet warms, the line corkscrews outward, inching closer to the 1.5 degree Celsius aspirational warming limit agreed to during the historic climate change agreement in Paris last December.
Hawkins writes on his blog, the Climate Lab Book, that his creation "presents global temperature change in a visually appealing and straightforward way."
"The pace of change is immediately obvious, especially over the past few decades," he writes. "The relationship between current global temperatures and the internationally discussed target limits are also clear without much complex interpretation needed."
Particularly unsettling is the drastic temperature jump witnessed in the second half of 2015 and the first few months of this year. Many climatologists say that the 2 degrees Celsius threshold is a best case scenario that would still result in drastic impacts to the planet.
Both 2014 and 2015 set consecutive records for the hottest year in recorded history. And if its scorching start is any indication, 2016 will likely follow suit.