
If there's one takeaway from this misleading climate change graph shared by the conservative National Review, it's that data visualization is only as honest as the people using it.
National Review, a conservative magazine and website that constantly dismisses the threats posed by runaway carbon emission, tweeted a graph Tuesday showing global temperatures shifting from 1880 to the present day, calling it "the only #climatechange chart you need to see." The graph, which was originally created by the conservative political blog Power Line, doesn't lie or use any invented data, but it does use a y-axis scale that could make just about anything seem completely stagnant.
By setting the upper and lower boundaries of the chart at minus 10 degrees and 100 degrees Fahrenheit -- two extremes that the planet won't have to get anywhere near before the catastrophic effects of climate change become apparent -- National Review and Power Line are essentially zooming so far out on the problem that it's impossible to see.
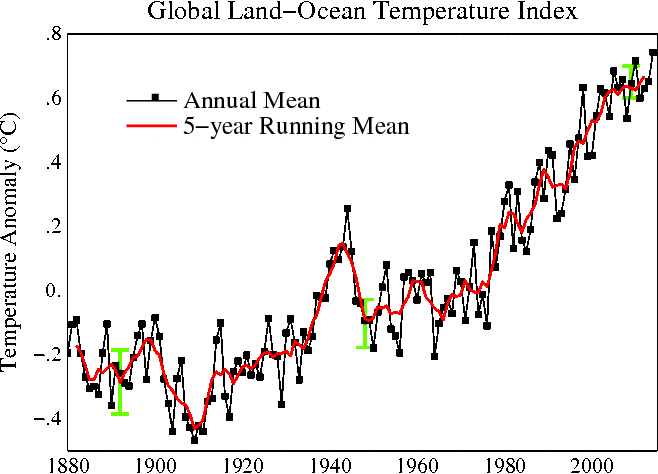
Here's a chart from NASA's Goddard Institute for Space Studies showing the same information:
The Washington Post summed it up best: "It's akin to suggesting that Shaquille O'Neal and Mini-Me (aka Verne Troyer) are the same height because they're both tiny compared to the planet Jupiter."
Scientific consensus holds that the planet will only need to warm 2 degrees Celsius, or 3.6 degrees Fahrenheit, in order to hit the threshold at which the damage will be irreversible.
Twitter users responded to National Review by creating funny, fact-obscuring graphs of their own: